[Abstract] Static compression tests of two types of honeycomb paperboard under different speeds were carried out by RMT computer-aided pressure automatic test system. The characteristics of continuous static compression F-δ and σ-ε were obtained. The experimental results show that the static compression characteristics of honeycomb paperboard are basically the same under the two kinds of speed compression, and there are obvious four stages of elasticity, elasticity, plasticity and compaction deformation. Therefore, it can be used in certain design and application occasions of honeycomb paperboard. The small rate static compression feature replaces the large rate static compression feature, thereby simplifying the problem.
Key words: honeycomb paperboard; static compression characteristics; test
Honeycomb paperboard is a new type of environmental protection packaging buffer material with high pressure resistance and good cushioning performance. Currently used in the packaging industry, such as packaging cartons, packaging cushions, trays and so on. The in-depth understanding of its basic mechanical properties is the basis for the design and application of this new type of material, so many scholars have studied the basic characteristics of honeycomb paperboard. At present, due to the limitation of test conditions, the research on the compression characteristics of honeycomb paperboard mainly focuses on the experimental research of static compression characteristics. The obtained static compression characteristic test performance curves are fitted by several points obtained from the test, instead of the actual measurement. The continuous performance curve, therefore it is necessary to carry out experimental research on its actual continuous performance curve. In addition, the buffering characteristics of honeycomb paperboard should be mainly related to the large-rate static compression characteristics, so it is also necessary to study the large-rate static compression characteristics. The compressive characteristics of honeycomb paperboard were tested using the RMT computer-aided pressure automatic test system which can measure the continuous compression performance curve. The curves of continuous static compression F-δ and σ-ε under different compression rates were obtained.
1 Experimental Study on Static Compression Characteristics of Honeycomb Paperboard
1.1 Low-rate static compression
1.1.1 Low-rate static compression test
Tests using two kinds of honeycomb paperboard, paperboard sample area A = 100 × 100 (mm2), thickness t = 20 ~ 30mm, of which 20mm thickness honeycomb paperboard paper core is 130g / m2, honeycomb hexagonal side length of 10mm; 30mm thickness honeycomb paperboard paper core is 160g/m2, honeycomb hexagonal side length is 12mm, ambient temperature 26°C, relative humidity 79%. The experimental equipment is a BMT computer-assisted pressure automatic testing system, which uses the A method for experiments. The specimen is gradually increased in the thickness direction at a speed of 6 mm/min. The experimental equipment can automatically and continuously measure and record the pressure and deformation change process and finally automatically draw the pressure (F)-deformation (δ) characteristic curve. The F-δ curve of the static compression characteristics of a single layer of 20mm thickness, 2 layers of 20mm thickness superimposed composite and a single layer of 30mm thickness honeycomb paperboard obtained from the test is shown in Figs. 1-3.
1.1.2 Analysis of Static Compression Characteristics at Low Rates
Use the following formula:
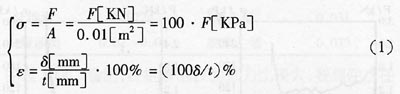
The F-δ curve can be converted to a σ-ε curve, where only the vertical and horizontal coordinate units and values ​​change between the two graphs without any change in the shape of the graph.
In the formula: F is the pressure applied to the sample; A is the area under pressure of the sample; σ is the compressive stress generated in the sample; δ is the displacement generated by the sample; t is the thickness of the sample; ε is generated by the sample strain. (to be continued)